Overview
Learners step into the role of a Geographic Information Systems (GIS) specialist and answer a question their own community could actually face: where should a new emergency warming centre be built? Working in pairs, they stack real provincial map layers, measure distances and areas on the ground, convert those measurements into scores, and apply a weighted suitability formula to rank three candidate sites. They finish by defending a recommendation with numbers rather than opinion.
NB Curricular Connections
Mathematics 9
- Strand: Statistics and Probability
- Big Idea: Data Analysis
- Skill Descriptor:
- Create and interpret graphs to solve problems.
- Compare and critique the presentation of data
Geometry, Measurement and Finance 10
- Strand: Shape and Space
- Big Idea: Measurement
- Skill Descriptor:
- Solve problems using linear SI and Imperial measurements and verify solutions.
- Solve problems that involve area using SI and Imperial measurements and verify the solutions.
What You’ll Need
- One internet-connected device per learner or per pair
- GeoNB Map Viewer — free, no account required: ca/en/campaign/geonb/applications/map-viewer.html
- GeoNB Flood Hazard Maps — free, no account required: snb.ca/flood_hazard_maps
- Google Earth for Web, used for the measure tool — free, no sign-in required: google.com/web
- A projector or display for the opening demonstration
- One printed Site Suitability Scorecard per pair, or a shared digital copy
- Calculators
- Optional for the unplugged opening: three clear transparency sheets and dry-erase markers
Instructions
Before the lesson (about 10 minutes of prep):
Choose three real candidate sites in or near your community — an empty lot, a school or community hall, a parking lot, a closed business. Sites that are genuinely different from one another produce the most interesting disagreement. Note the address or a dropped pin for each, and decide what counts as the centre of the service area you are trying to cover. Check each site once yourself in the flood hazard viewer so nothing surprises you mid-lesson.
Investigation:
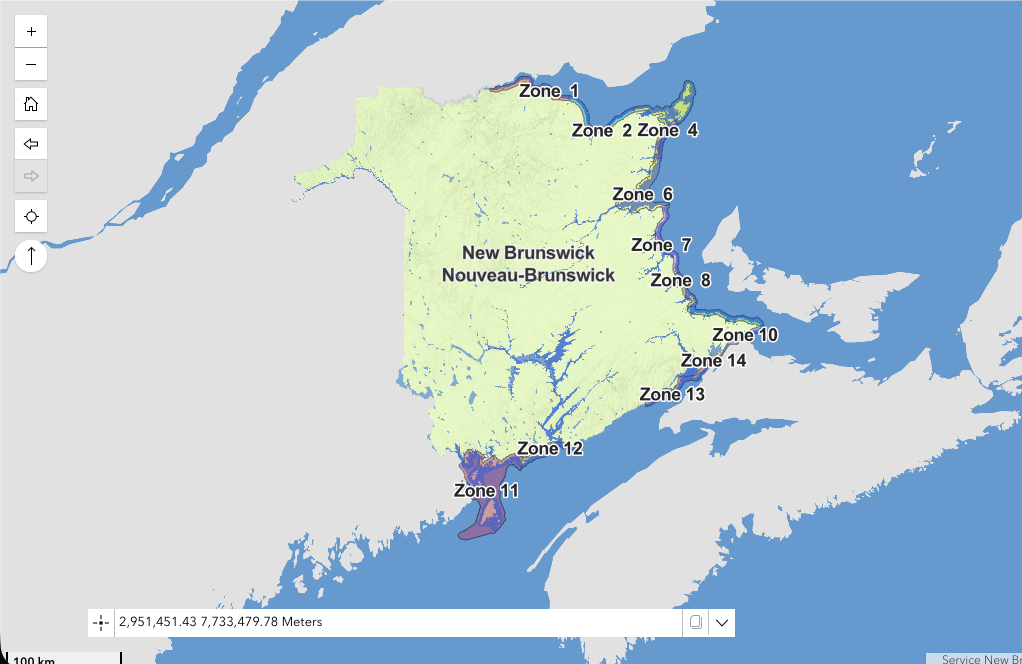
- Layer up (10 minutes). Display the GeoNB Map Viewer on your SMARTBoard or other screen, zoomed to your community. Turn layers on one at a time and ask what each layer alone can and cannot tell you. Then switch to the Flood Hazard Maps viewer and add the flood hazard layer. Ask the question that drives the lesson: no single layer answers “where should we build this,” so how do you combine them?
- What’s a GIS specialist? (5 minutes). Tell learners the flood layer they just clicked was produced by GIS specialists at the Department of Environment and Local Government, and that it now shapes where houses get insured and where roads get rebuilt. Name the job, the training routes, and the range of workplaces. Keep this short — the point is that a real person made the map they are about to use.
- Model the mathematics (10 minutes). Introduce weighted overlay. Four criteria matter, but not equally, so each gets a weight: flood risk 4, distance to the centre of the service area 3, usable lot area 2, access from a main road 1. Each site earns a score from 1 to 5 on each criterion, and the suitability score is the weighted mean:
S = (4F + 3D + 2A + 1R) ÷ 10
Work one criterion through on the board so learners see the whole chain: measure, score, weight, combine. Ask why the denominator is 10 and what the largest possible value of S is — if they can explain why S can never exceed 5, they understand the formula rather than the recipe.
- Measure and score in pairs (30 minutes). Pairs open Google Earth for Web, find each candidate site, and use the measure tool to record the straight-line distance from the site to the centre of the service area, the usable area of the lot, and the distance to the nearest main road. Measurements go in metres and square metres. Then they check each site against the flood hazard layer in GeoNB. Using the scoring key below, they convert every measurement into a 1–5 score, fill in the scorecard, and compute S for all three sites. The GeoNB Map Viewer has its own measurement tools, so a class that prefers to stay in one window can do the whole step there instead.
- Defend your recommendation (10 minutes). Each pair states its winning site and its suitability score in one sentence, then gives the single number that made the difference. Where pairs disagree, trace the disagreement back to a measurement or a scoring decision rather than to opinion. Close with the question a GIS specialist gets asked constantly: who decided flood risk was worth four times as much as road access, and what happens to the answer if that changes?
Career Connections
- Data Analyst
- GIS Specialist
- Engineering
- Surveyors
Extension Ideas
- Sensitivity analysis. Swap the weights on flood risk and distance, then recompute. Does the winning site change? GIS specialists run this test before presenting to a council, because a recommendation that flips under a small change in assumptions is a fragile recommendation.
- Graph the profile. Build a multiple-bar graph showing all four criterion scores for the three sites side by side. A site can win on total score while losing badly on one criterion, and the graph makes that visible in a way the single number hides.
- Critique a published map. Compare how the same flood data looks with the raster transparency turned up versus down. Discuss which version a homeowner should see, and what an honest map owes its reader.
- Change the question. Rerun the model for a different facility — a food bank, an EV fast-charging station, a new trail head — and let learners set their own criteria and weights. Defending the choice of weights is harder than the arithmetic, and closer to the real job.
- Invite a practitioner. Regional service commissions, Service New Brunswick and municipal planning departments all employ GIS staff, and many will join a class virtually for twenty minutes.
Digital Literacy Competencies
- Critical Thinking and Meaning Making — learners interrogate what each map layer does and does not show before trusting it.
- Computational Thinking — learners decompose a messy siting question into weighted criteria and apply a repeatable algorithm.
- Communication and Collaboration — pairs negotiate scoring decisions and present an evidence-based recommendation.
Related Global Competencies
- Critical Thinking and Problem Solving (CTPS) — learners weigh competing criteria and justify a recommendation with evidence.
- Collaboration (CL) — pairs divide measurement work and reconcile differing scores.
- Sustainability and Global Citizenship (SGC) — learners confront climate-driven flood projections as a factor in community planning.
Reflection Tools
Please see the attached PDF for several choices on how you and your learners can reflect upon today’s activity.
Career-focused prompts to draw on:
- Which part of this did you enjoy most — the measuring, the deciding, or the arguing? A GIS specialist does all three.
- What surprised you about how much judgement went into a task that produced a number?
- Would you want a job where your map changes what gets built?